Section 5 GElyser
5.1 Interface
Input
Step 1: Enter a list of genes. Please ensure that the input gene identifiers are official symbols; otherwise, the error messages will be prompted.Step 2: Select from a list of supported ontologies.More Controls: Use additional parameters to fine-tune the above steps.SUBMIT: click the SUBMIT button to execute the analysis.
Output
- Example Output includes interactive tables and high-quality figures for enrichment results. A summary of input data and the server-side computation runtime is also returned for reference.
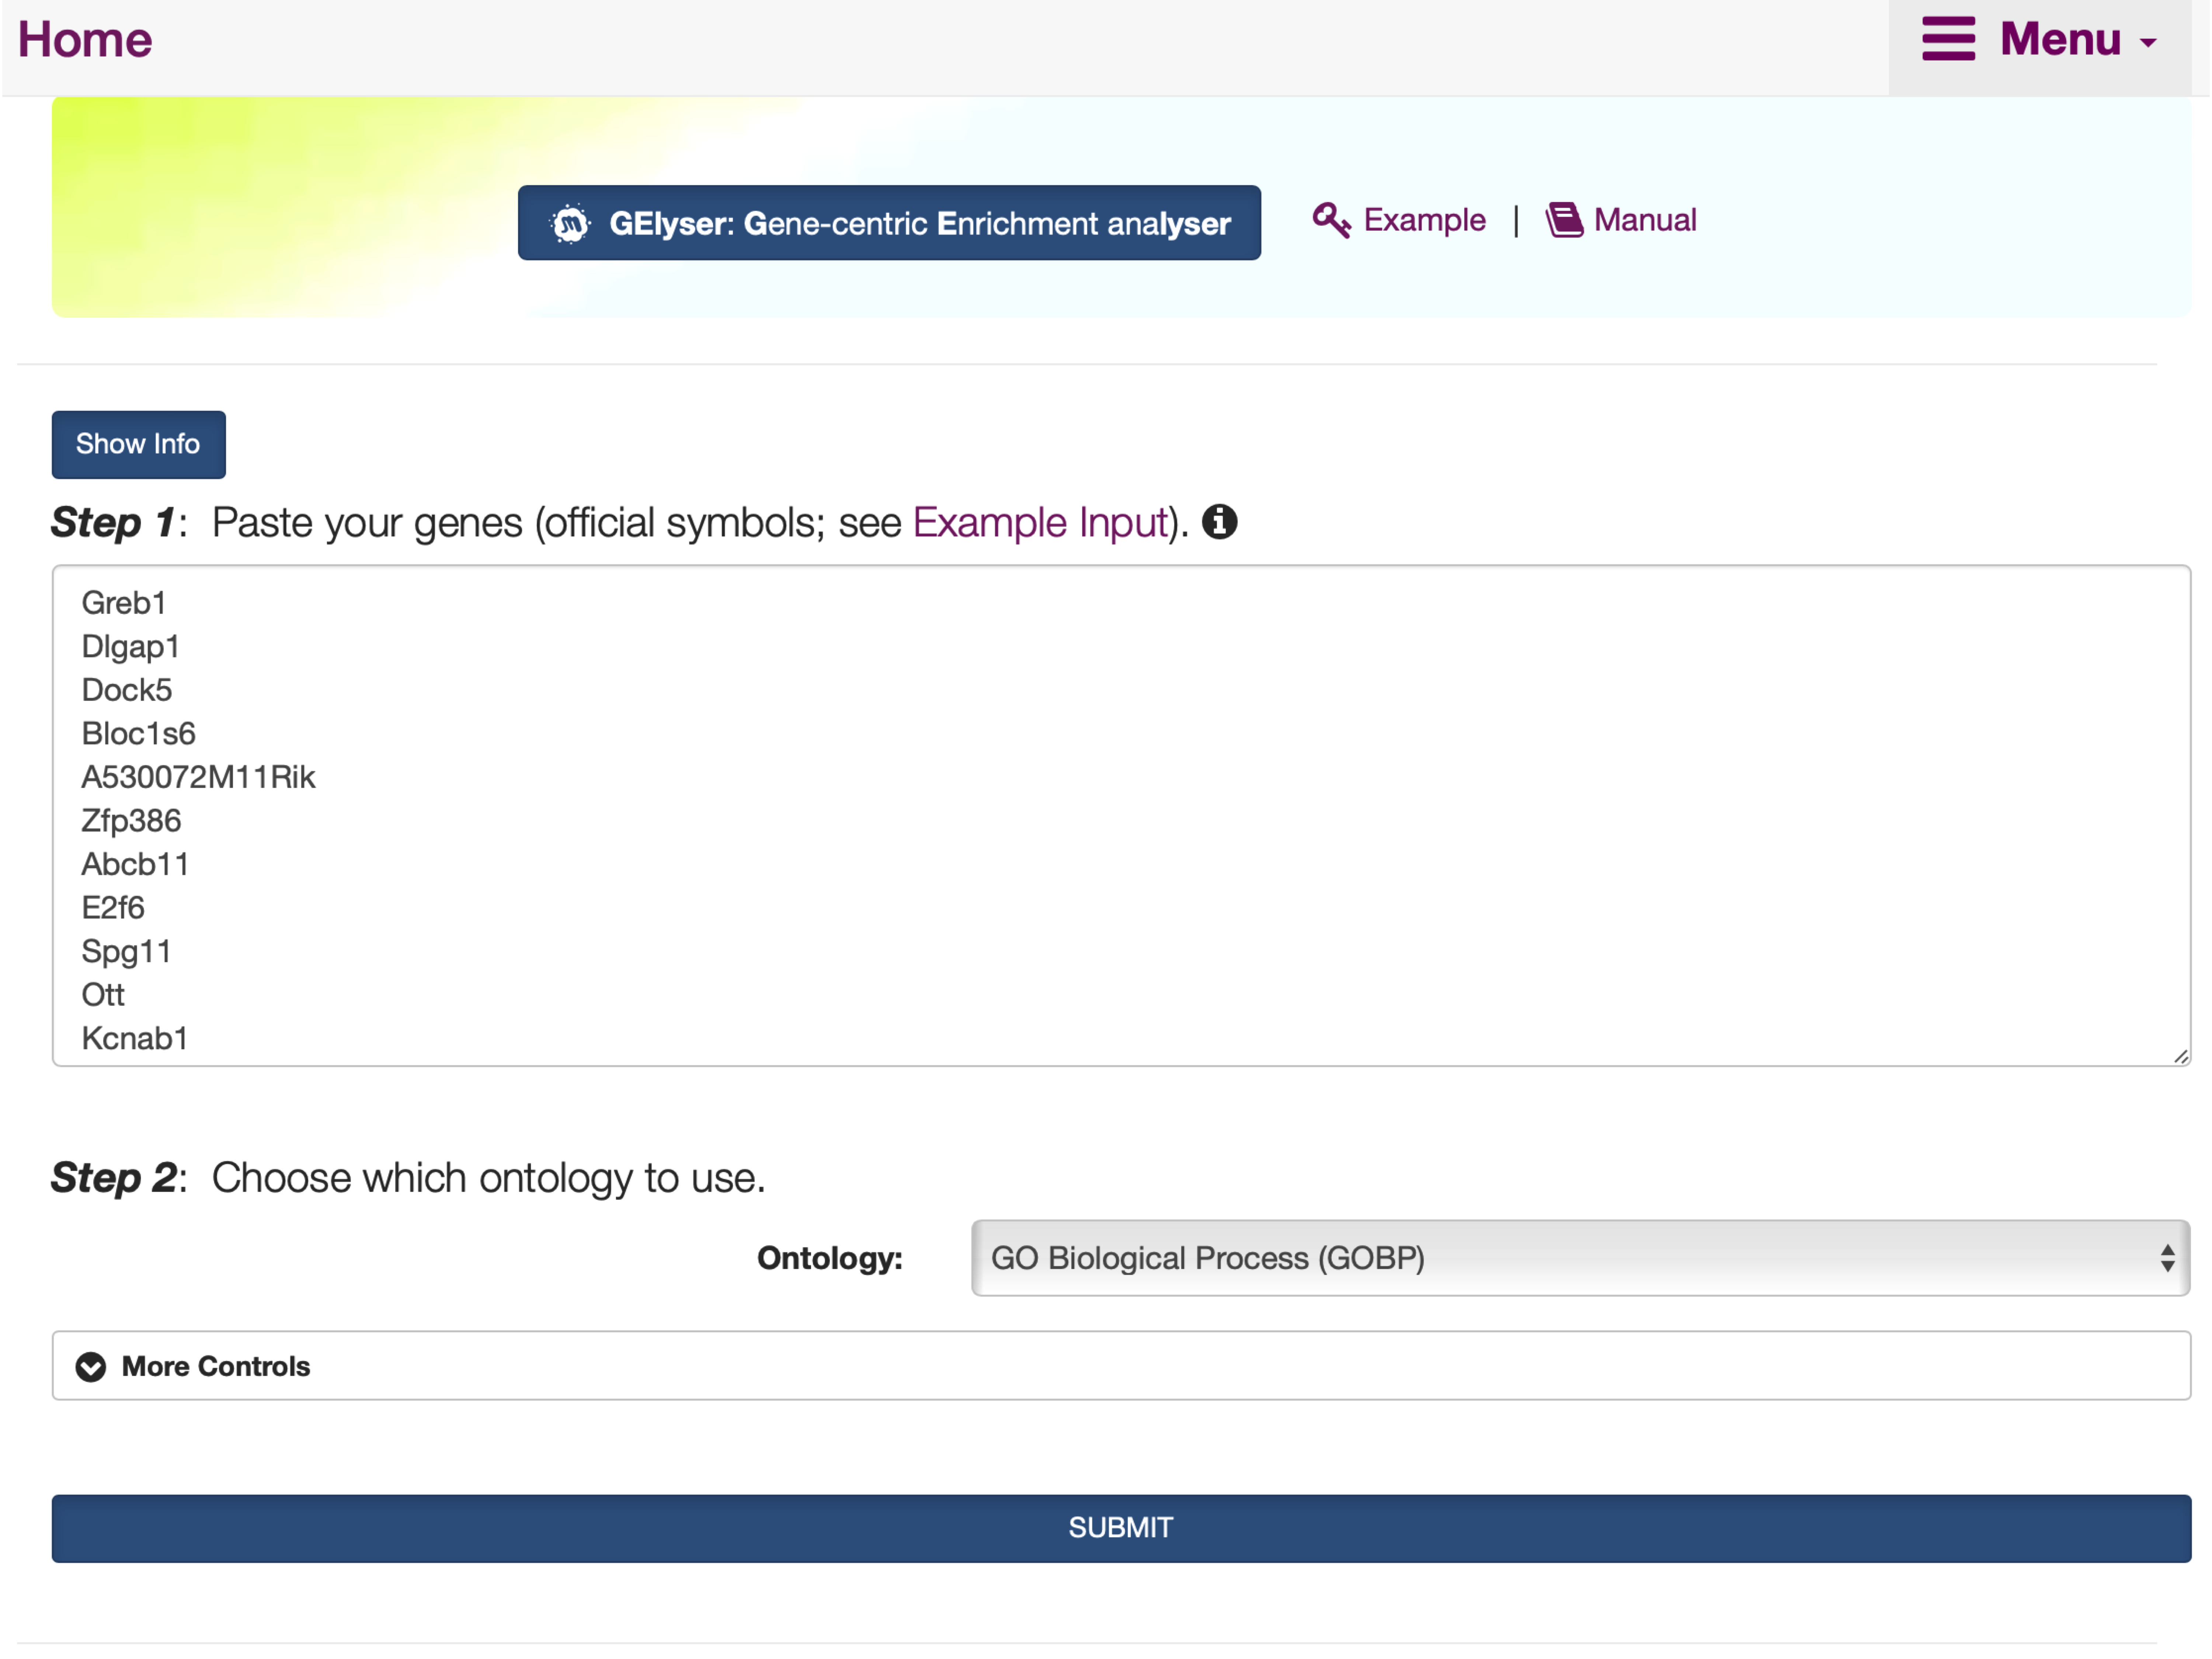
FIGURE 5.1: The interface of GElyser, including the Show/Hide Info toggle button that contains the help information on inputs, outputs, and other information.
5.2 Results
- Under the
Input: Gene Informationtab,An interactive tabledisplays the user-input gene list.
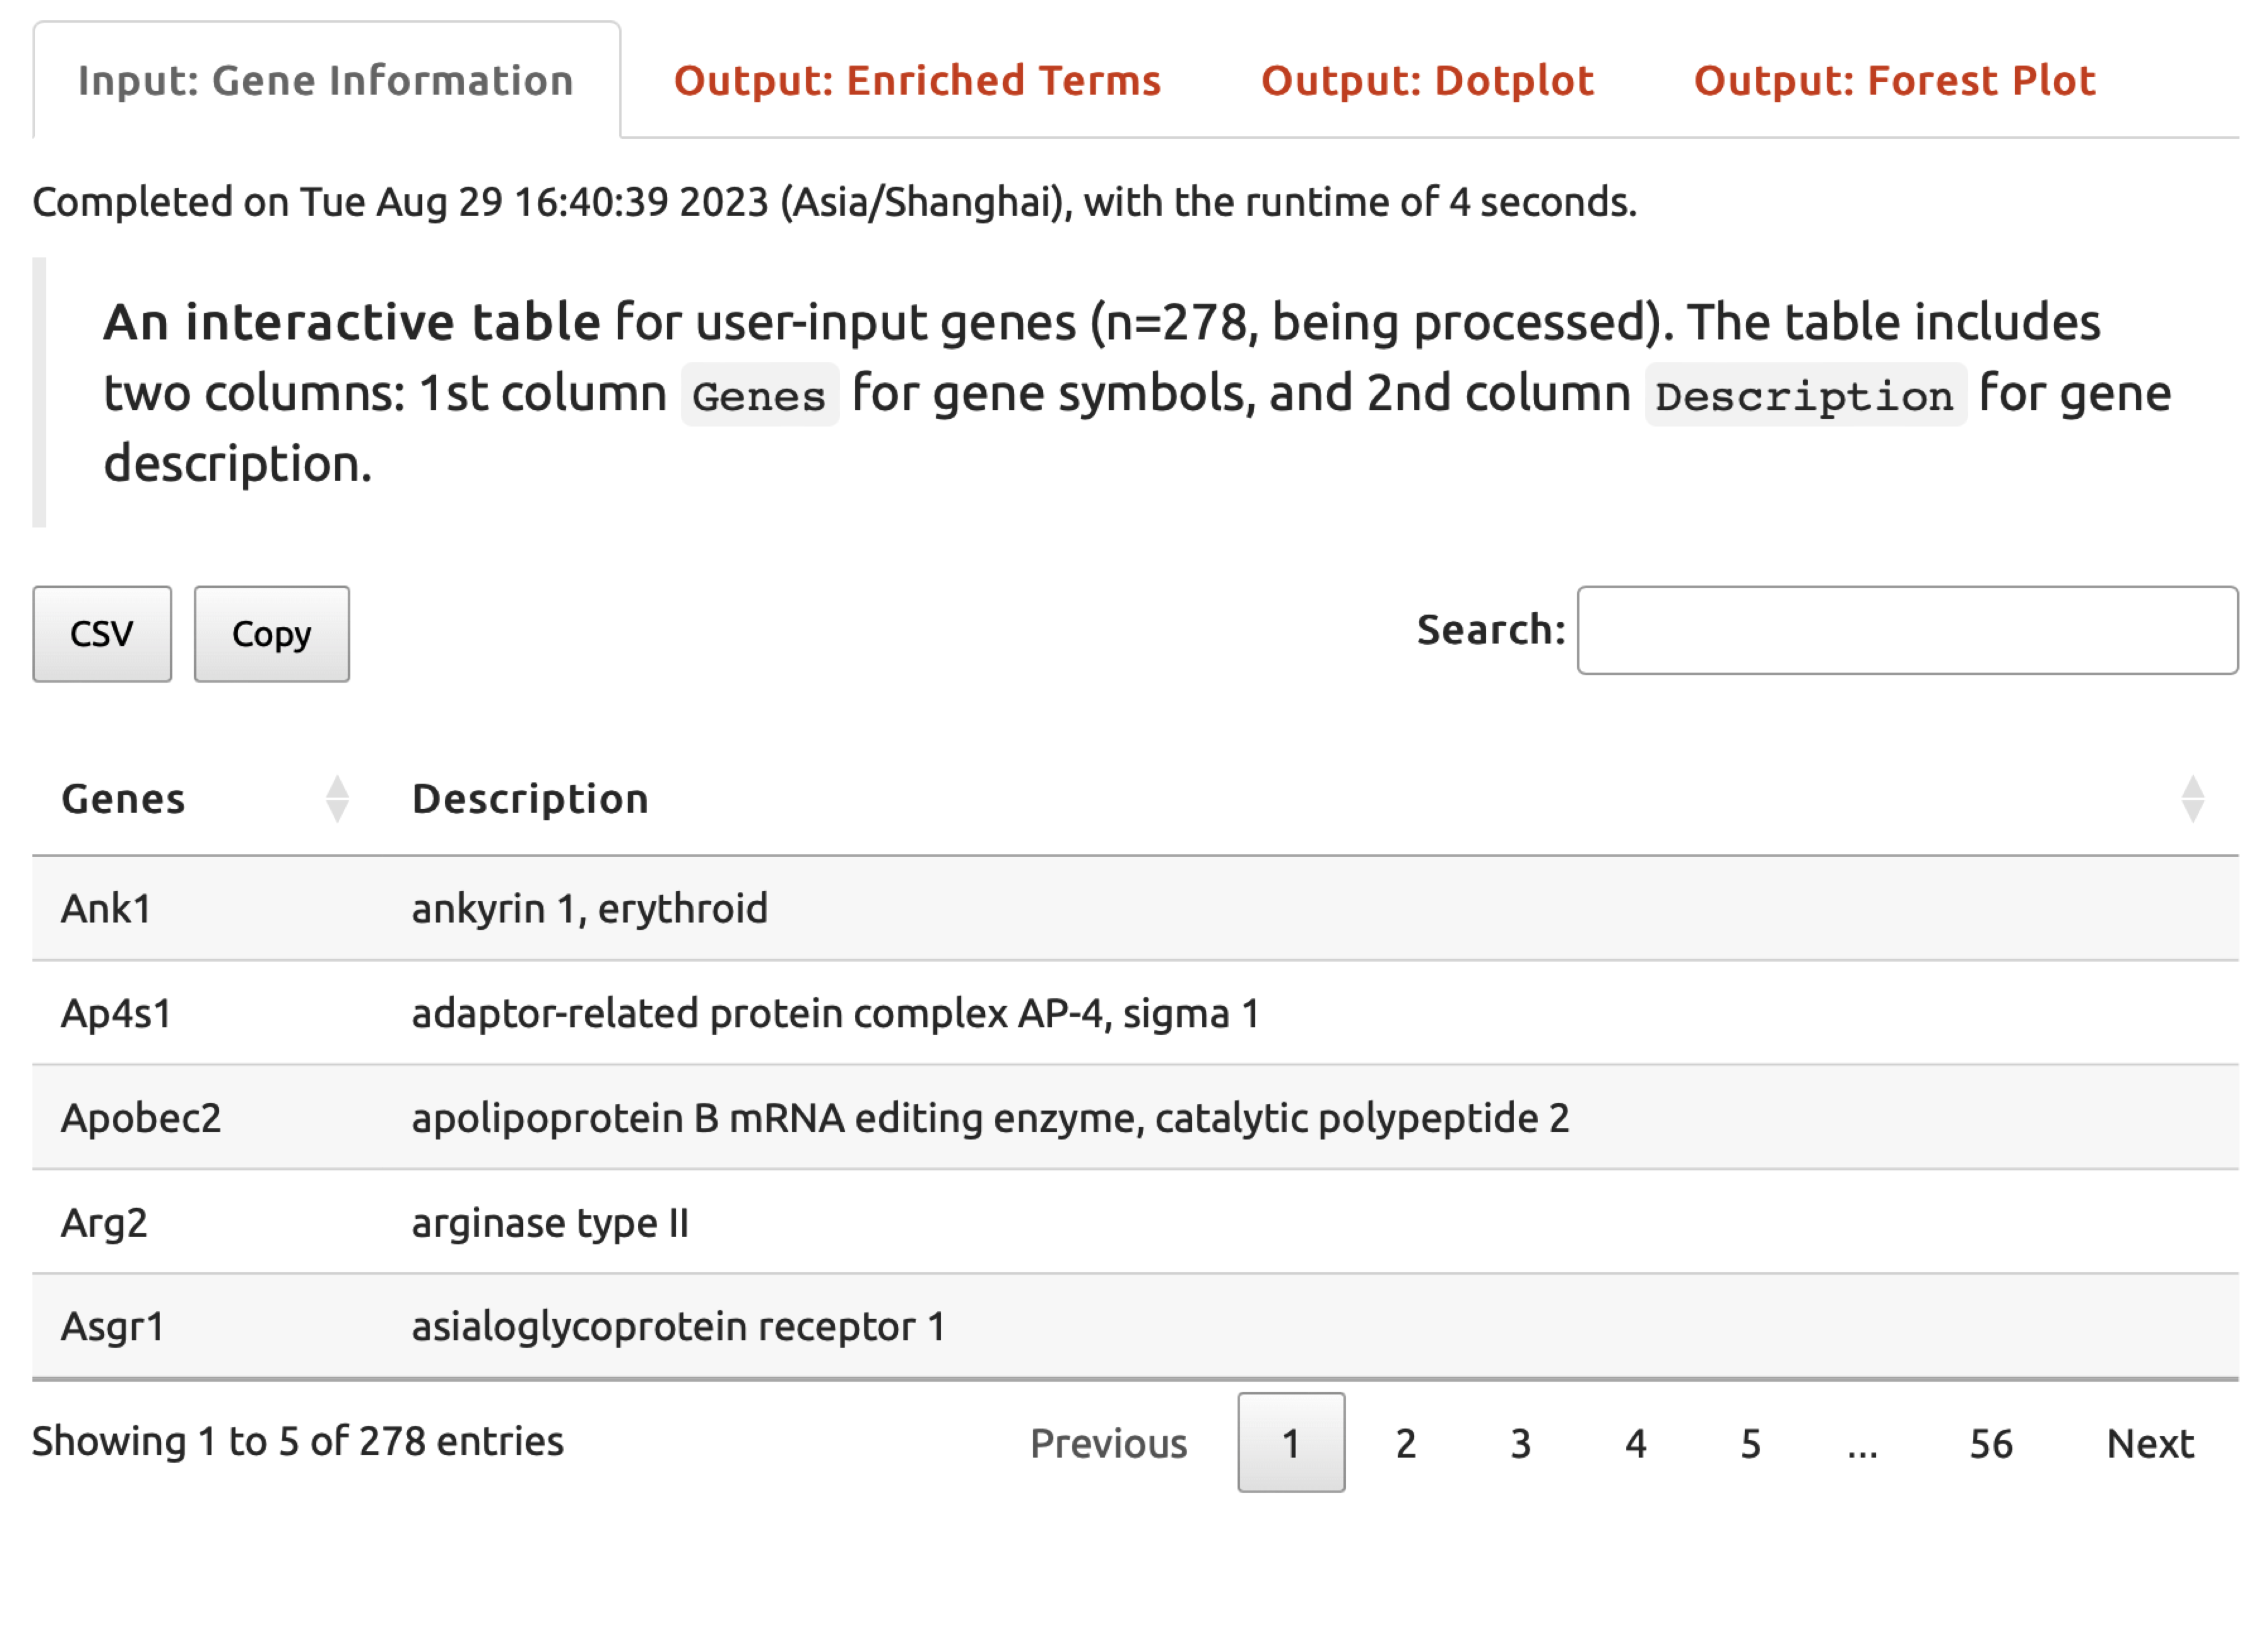
FIGURE 5.2: The user-input data displayed under the Input: Gene Information tab returned for exploration.
- Under the
Output: Enriched Termstab,An interactive tablelists enriched ontology terms.
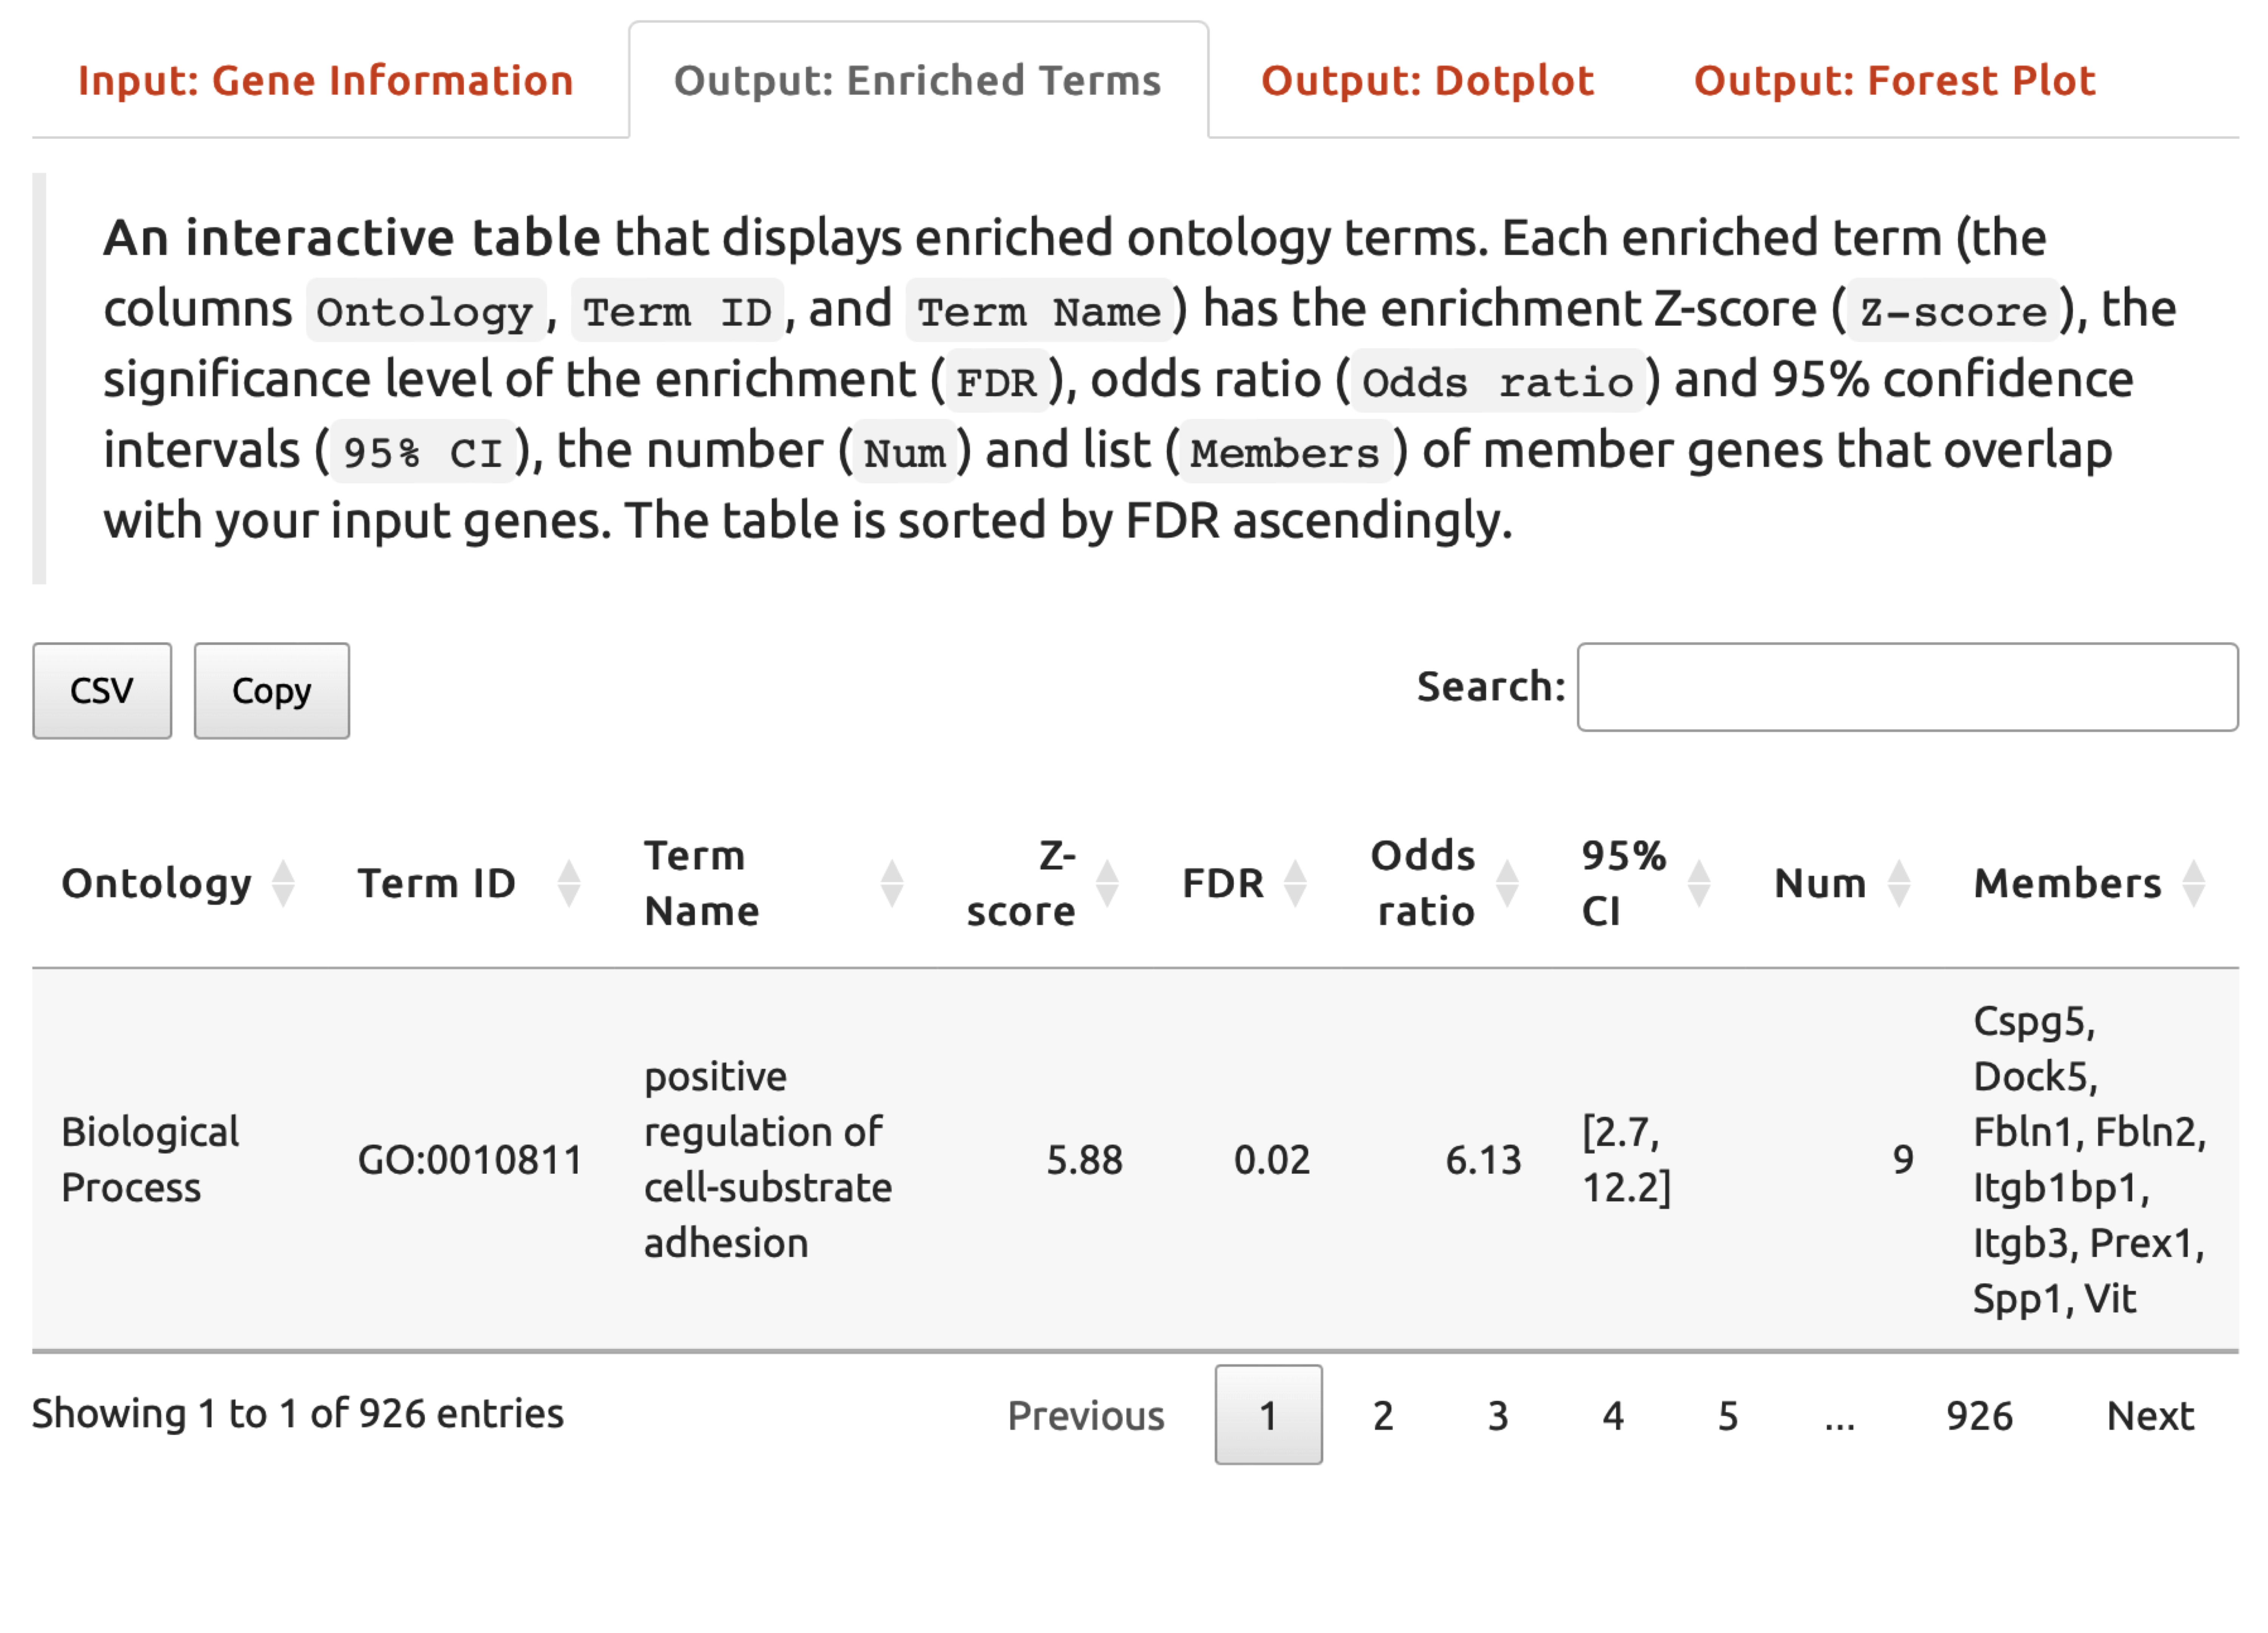
FIGURE 5.3: An interactive table listing enriched ontology terms under the Output: Enriched Terms tab.
- Under the tab
Output: Dotplot,An dotplotillustrates enriched ontology terms. The downloadable pdf file is also provided.
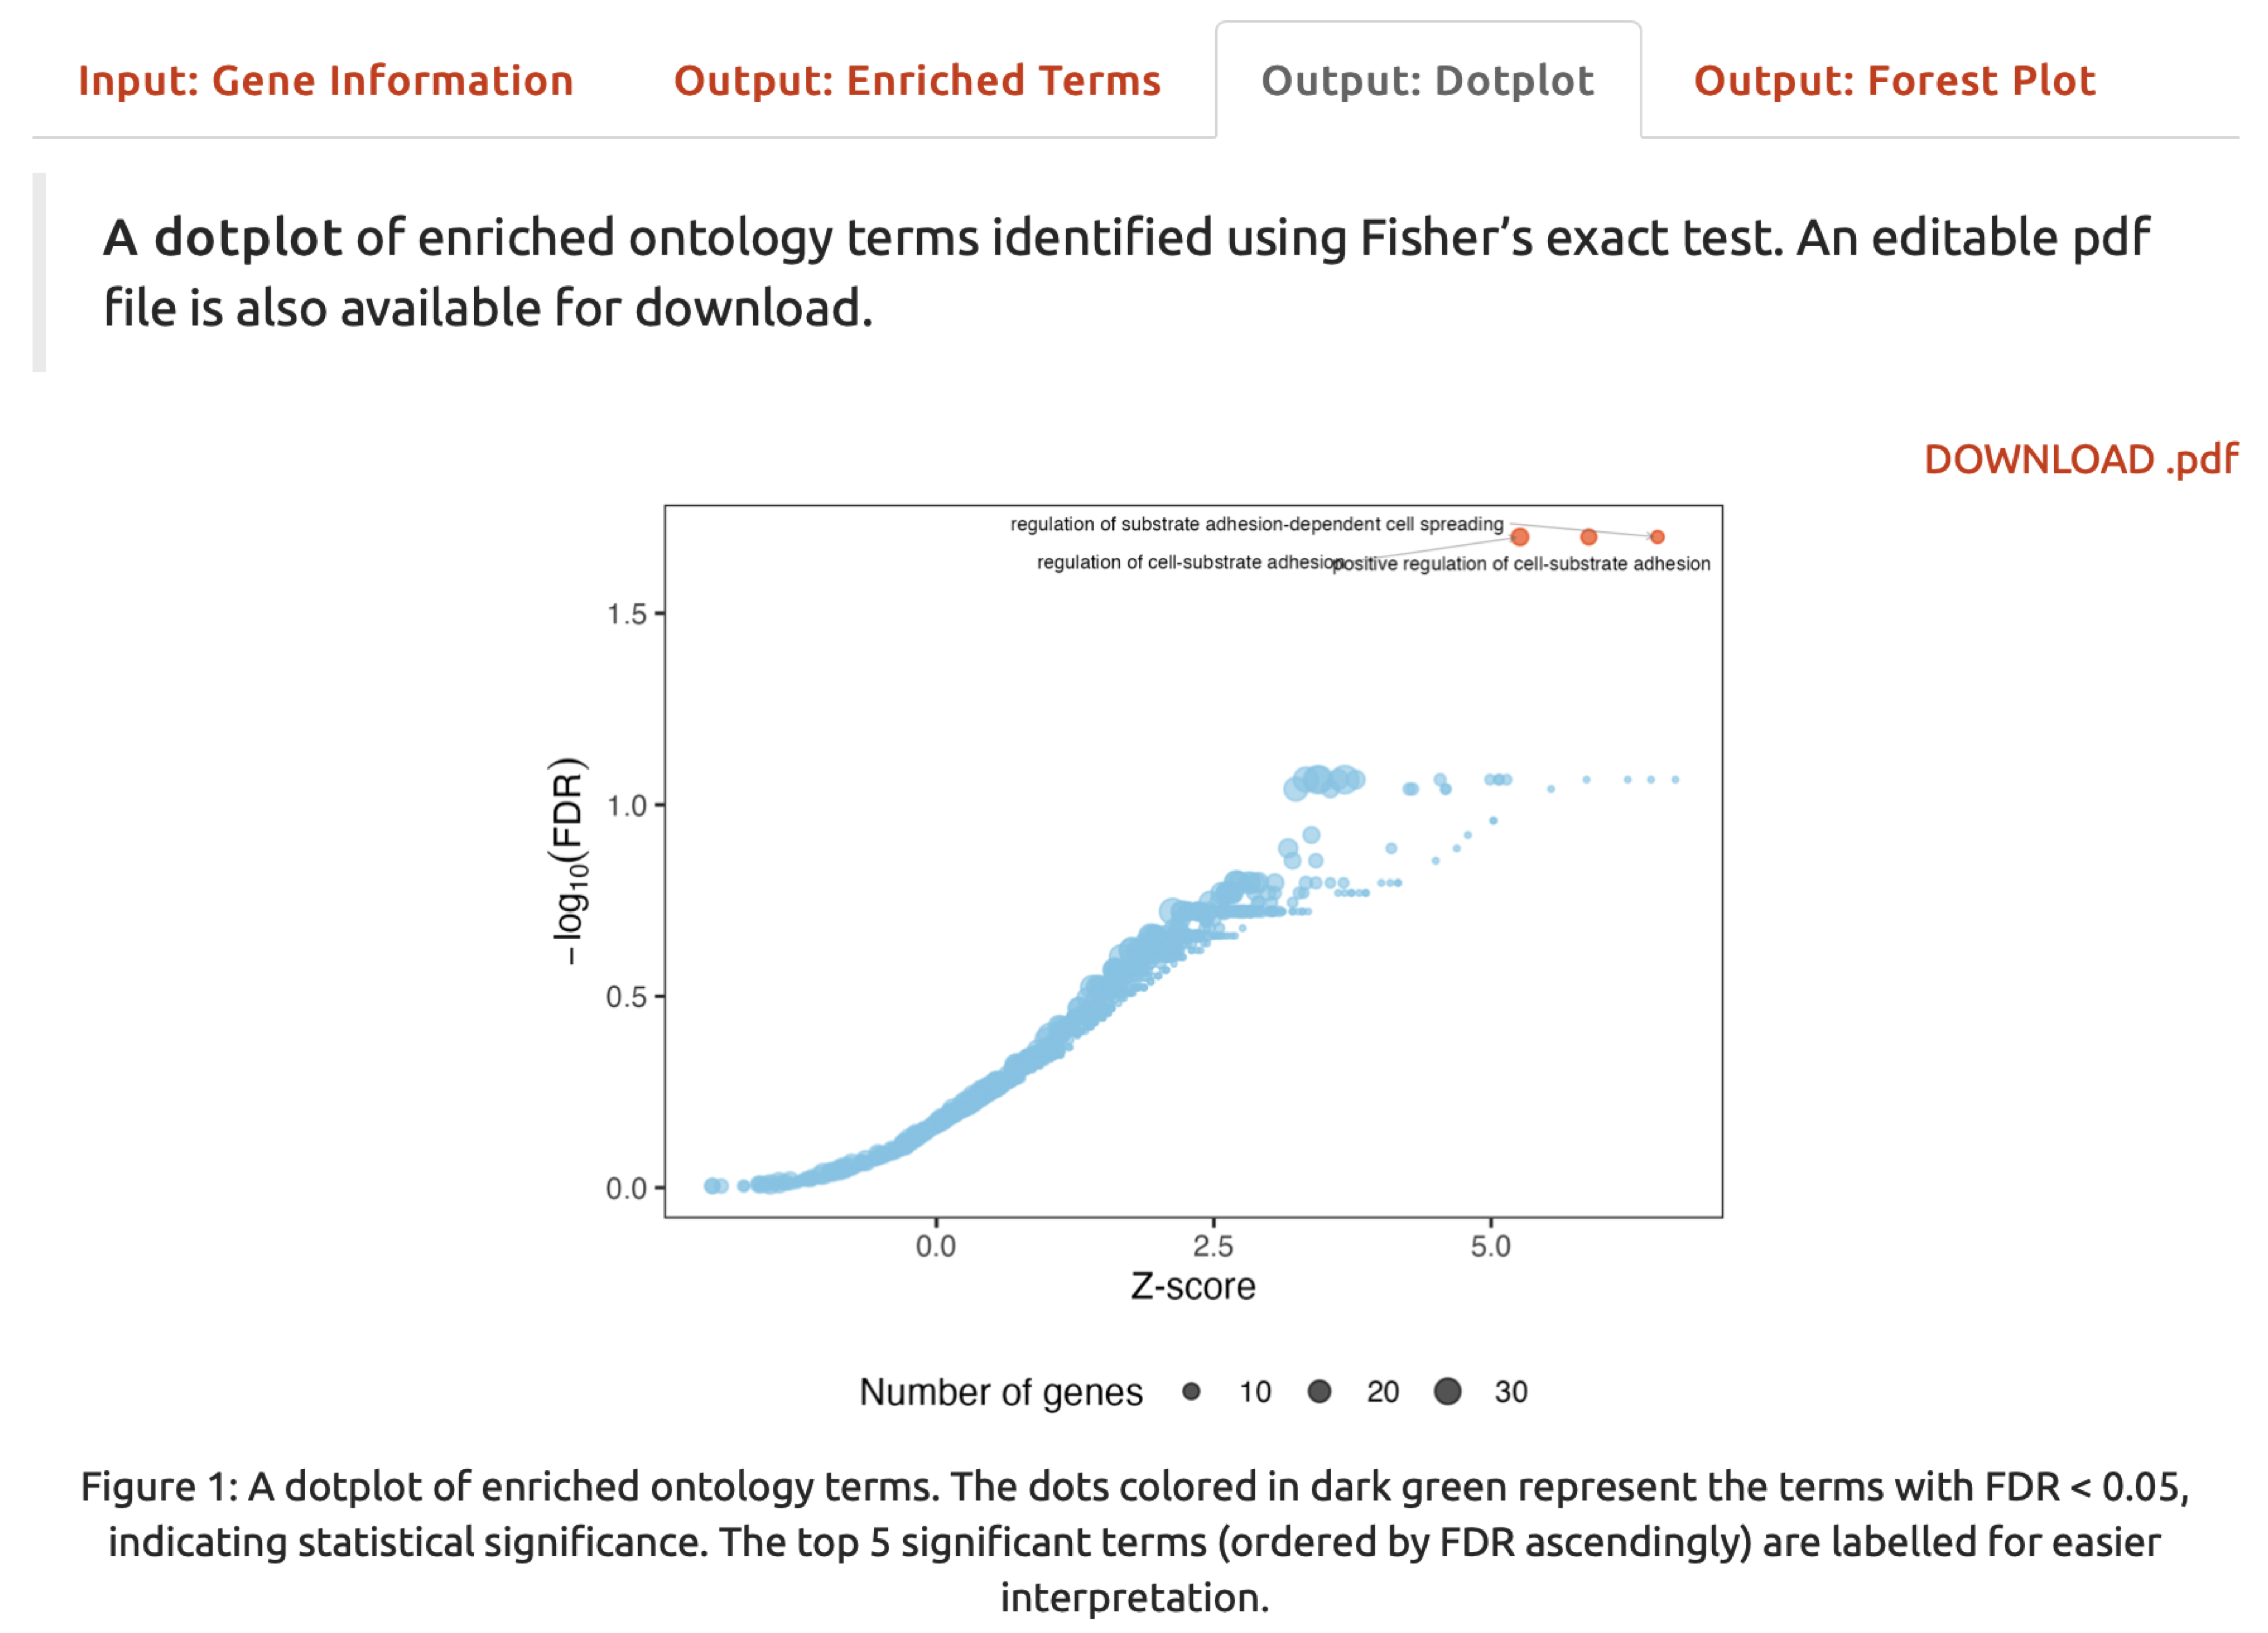
FIGURE 5.4: A dotplot for enriched ontology terms.
- Under the
Output: Forest Plottab,A forest plotillustrates enriched ontology terms. The downloadable pdf file is also provided.
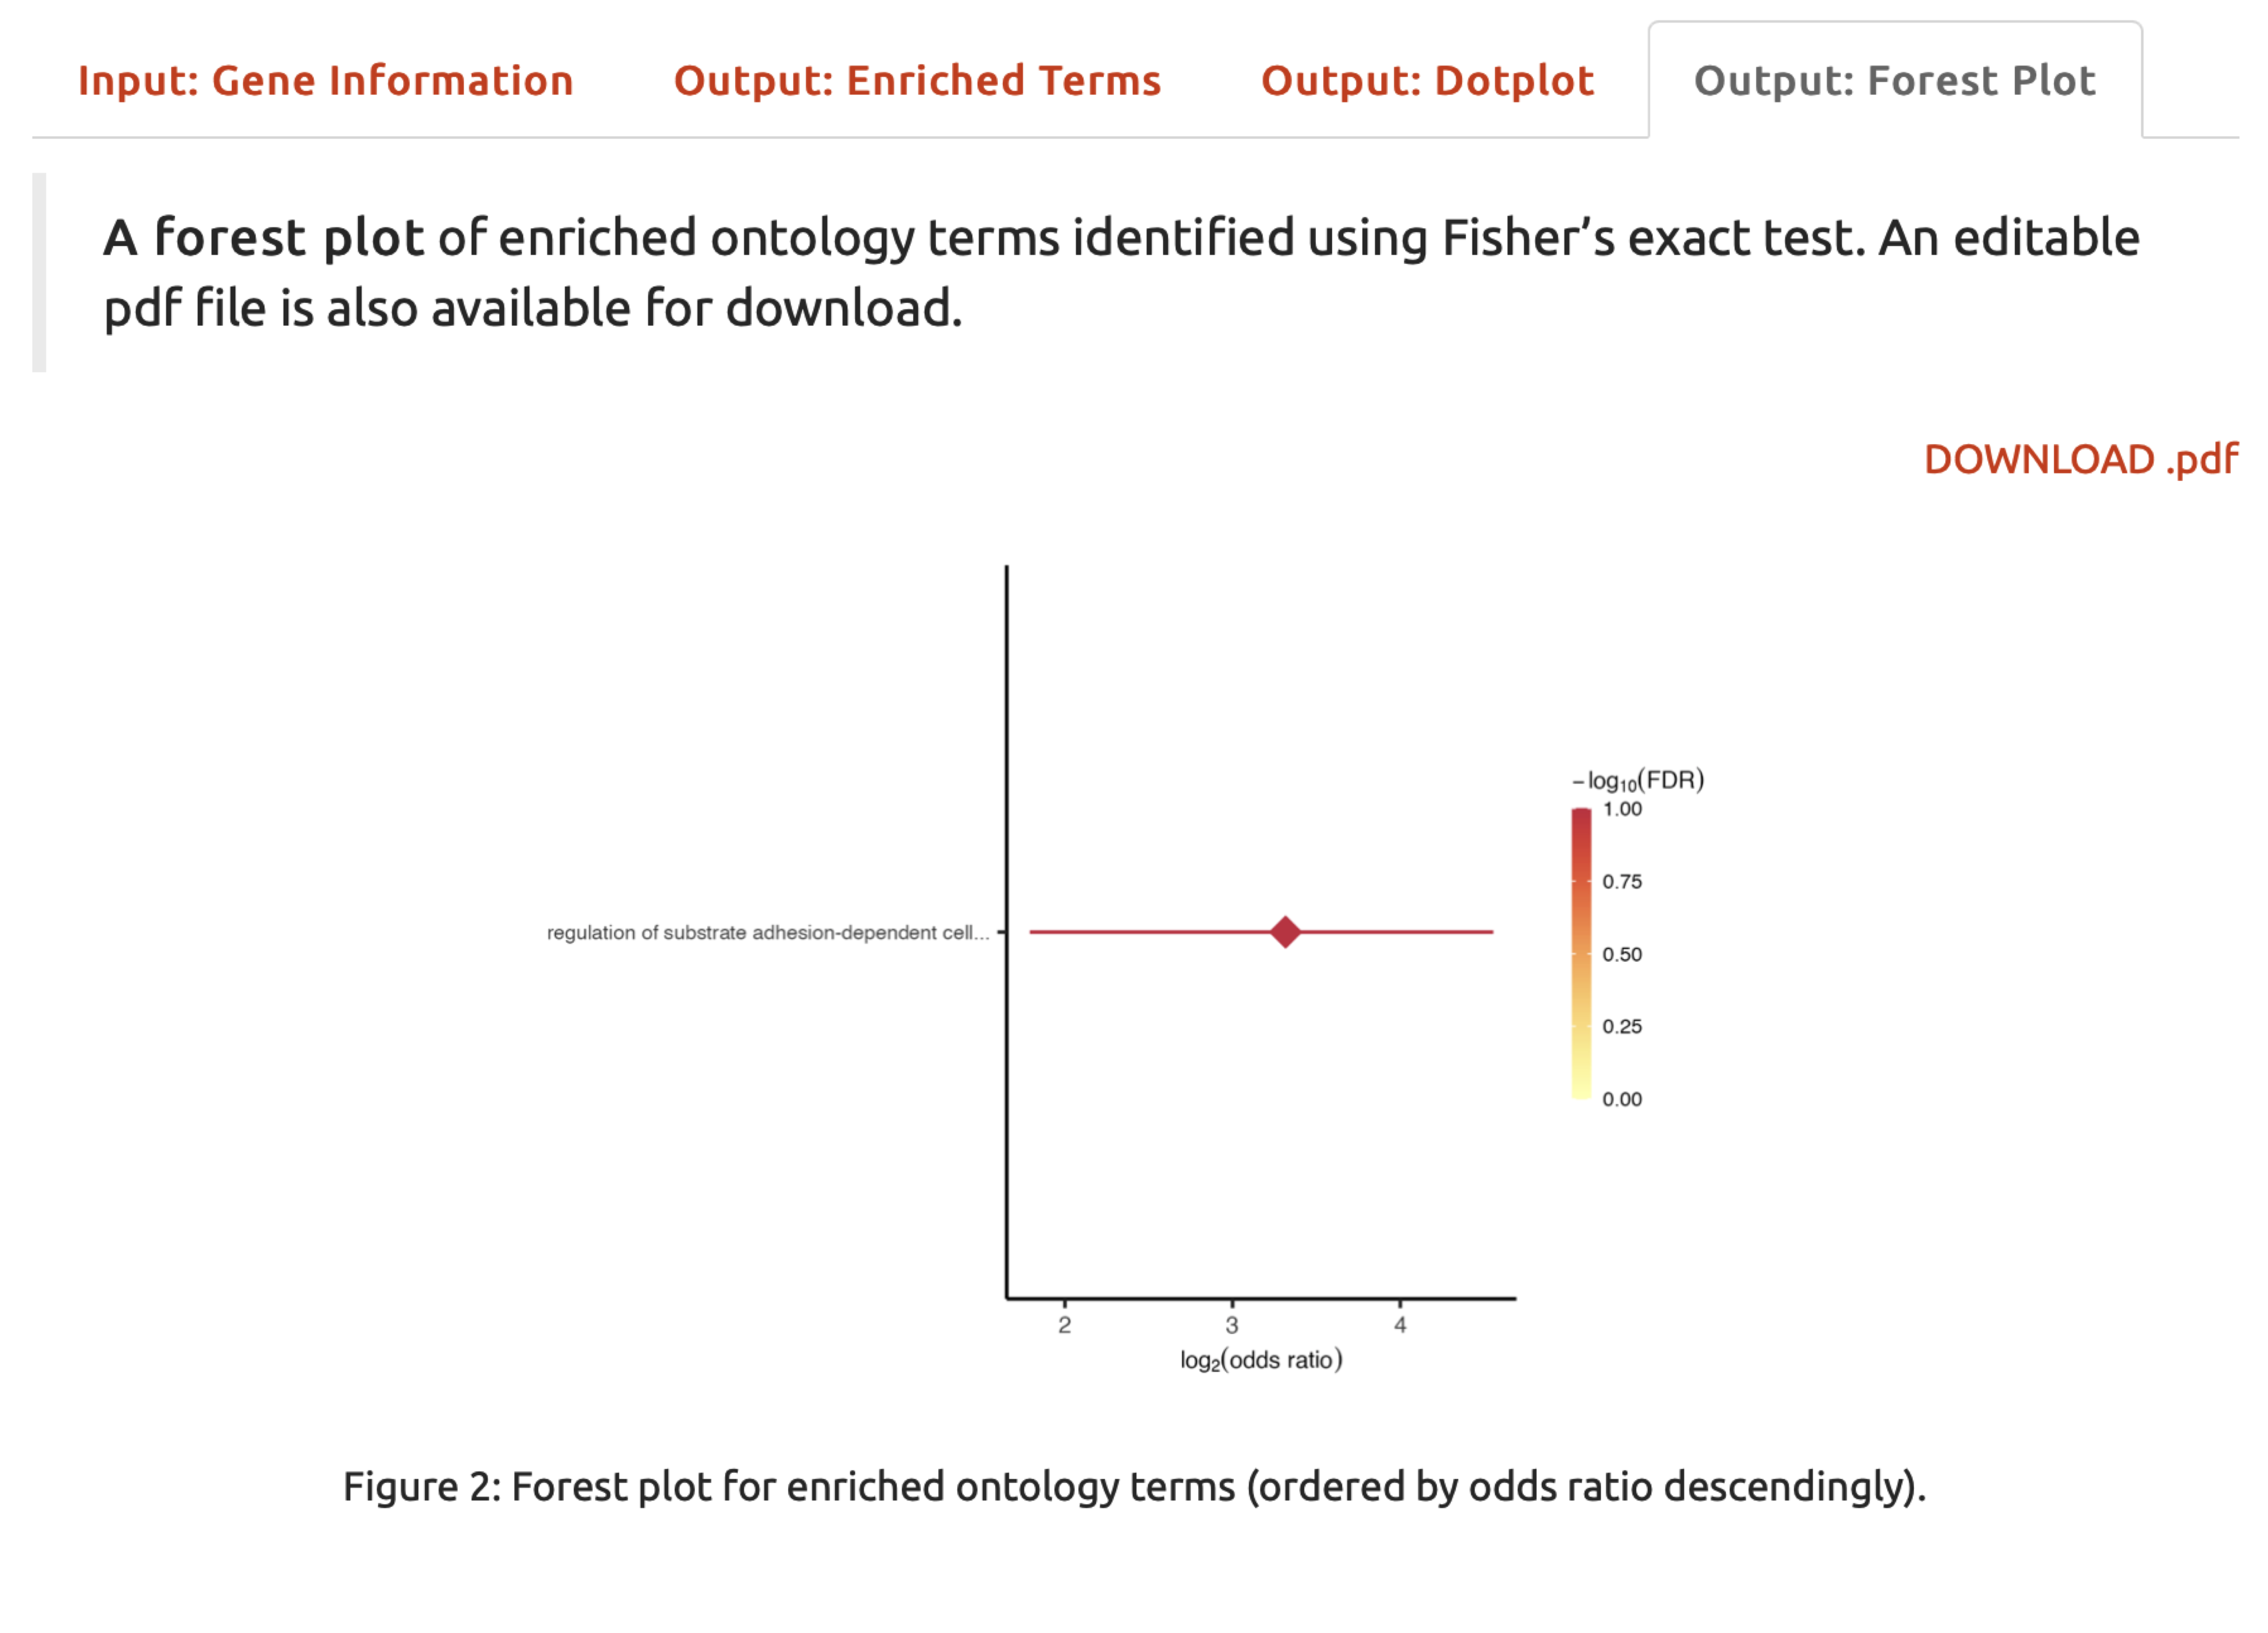
FIGURE 5.5: A forest plot for enriched ontology terms.